 Evaluation of materials properties for a selected application necessarily requires a method to compare different material sources. This is particularly true in the case of natural materials, those biocompatible and renewable constituents that can be extracted from biologic tissues.
Natural materials often come in the form of composites. Just think, for instance, about a human hair, which is composed of nanostructures of the protein keratin. Another even more pertinent example is given by the bone tissue, a nanocomposite formed by the inorganic hydroxyapatite and the organic protein collagen. It is clear that the combination of the two components, self-assembled with a precise macrostructure, endows bone tissues with the necessary properties for their function. As well, when materials are composites deriving from nano-objects, the dimension is a parameter that we need to consider in evaluating their potential performances.
A powerful tool for helping in materials selection is offered by the Ashby plot1. This is a scatter plot displaying at the same time two properties of materials or classes of materials. It is convenient because it gives useful information not only on which material displays the highest (or the lowest) property reported on the x- or y-axes, but also which one presents the highest ratio between the two properties. It is useful, in addition, to compare properties values with relation to material dimensions or density and offers also the possibility to condense a large body of information into a compact, but accessible form.
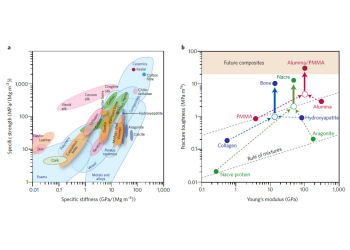
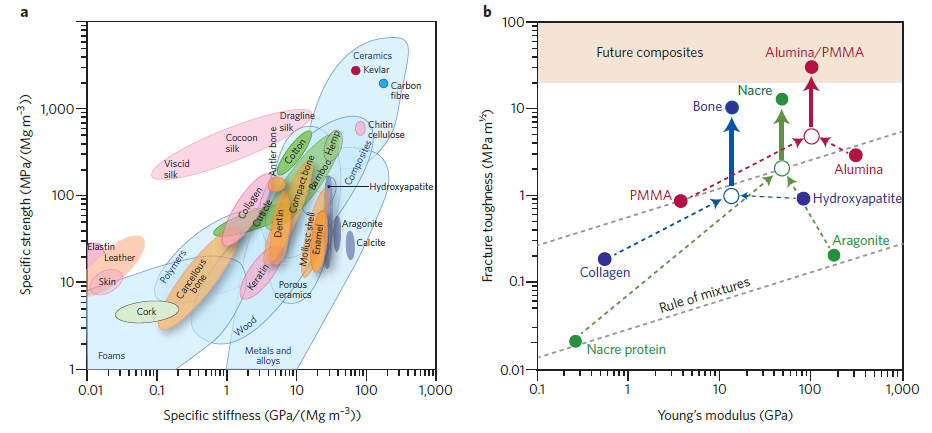
A three-dimensional Ashby chart in which the third dimension is represented by density can be easily transposed into a bi-dimensional scatter plot by normalizing by density the other two properties. This is the case for the chart reproduced in the Figure 1a, with permission from Springer Nature. The two properties normalized by density are the specific strength (y-axis, fracture toughness normalized by density) and the specific stiffness (x-axis, Young’s modulus divided by density). The ratio strength/stiffness represents the strain at which the material ceases to be linearly elastic and signifies the “mechanical efficiency”, meaning the use of the least mass of material to do the most structural work. The chart shows different regions for natural (pink, deep blue, green and orange) and synthetic (only in blue) materials. They are enclosed in envelopes because data for a given family of materials (polymers, for example) usually cluster together.
Fig. 1: Ashby plots for natural and synthetic materials. a) specific properties normalized by density allow easy comparison with synthetic materials like polymers and ceramics; b) this chart shows how nanocomposites can display dramatically improved properties with respect to the starting building blocks. Reproduced from Nature Materials, Ref. 2, with permission from Springer Nature.
Looking at the chart, it is clear that synthetic materials can reach high values of strength and toughness. For instance, ceramics, Kevlar, and carbon fibers display values that are much higher than those of the best natural materials. This is commonly true, but with exceptions: for instance, silk can reach the extraordinary toughness of 1,000 MJ m–3 with a modulus of 10 GPa3, but also nanocelluloses can reach exceptional values, approaching those recorded for Kevlar4. These properties increase their overall appeal if one considers that all-natural structural materials use a limited chemical palette of inexpensive building blocks, the ones described above for human hair and bone tissue, whose individual properties are often meagre (for instance keratin or collagen): however, these building-blocks are typically arranged in a hierarchical architecture which is formed at ambient temperatures and displays enhanced properties. This is well represented in chart 1b: bone and nacre are natural composite materials with toughness values that far exceed those of their constituents (hydroxyapatite and collagen for bone, and aragonite and nacre protein for nacre). Their much higher fracture toughness is related to the microarchitecture of the final composite material. Generally speaking, composite materials dominate both charts: this justifies the wide interest towards these materials in the aerospace field and justifies our interest in natural nanostructured materials, including nanocelluloses.
References: 1 Michael F. Ashby, “Materials selection in mechanical design, Fourth Ed.”, 2011, Butterworth-Heinemann, Elsevier Ltd. 2 Ulrike G. K. Wegst, Hao Bai, Eduardo Saiz, Antoni P. Tomsia, “Bioinspired structural materials” Nature Materials, Volume 14, issue 1, 2014, 23-36, DOI: 10.1038/nmat4089. 3 J. M. Gosline, P. A. Guerette, C. S. Ortlepp, K. N. Savage, “The mechanical design of spider silks: From fibroin sequence to mechanical function” J. Exp. Biol., Volume 202, 1999, 3295-3303. 4 Robert J. Moon, Ashlie Martini, John Nairn, John Simonsen, Jeff Youngblood, “Cellulose nanomaterials review: structure, properties and nanocomposites” Chem. Soc. Rev., 2011, 40, 3941–3994.
THIS ARTICLE IS PART OF AN ACTION OF DISSEMINATION OF KNOWLEDGE AND RESULTS OF THE PROJECT SOLARLEAF, CO-FOUNDED BY COHESION AND DEVELOPMENT FUND 2007-2013 – APQ RESEARCH PUGLIA REGION “REGIONAL PROGRAMME SUPPORTING SMART SPECIALIZATION AND SOCIAL AND ENVIRONMENTAL SUSTAINABILITY – FUTUREINRESEARCH”, PROT. F6YRAO1.

Copyrights of this article belong to Alessandra Operamolla. All rights reserved.
